



Third-quarter performance driven by RevPAR growth
On 2 November 2026, Marriott International (NASDAQ: MAR) announced its financial results for the third quarter of 2026.
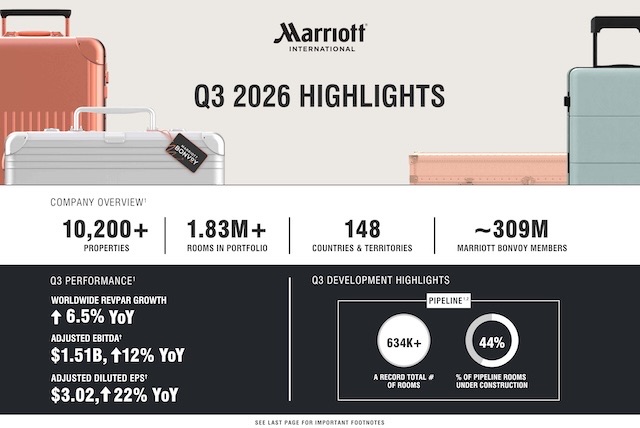
The US hotel group reported 6.5% growth in worldwide RevPAR, on a constant-currency basis, compared with the same period in 2025.
The increase was driven by improvements in both average daily rate (ADR) and occupancy.

Performance varied by region:
- United States and Canada: +7.4%, with growth across several customer segments and hotel categories.
- International markets: +4.4%, supported in particular by international leisure demand.
- Asia Pacific excluding China (APEC): more than 9%, the region recording the strongest growth.
- Europe, Middle East and Africa (EMEA): more than 4%, driven in particular by European performance.
In the Middle East, Marriott indicated that the regional conflict continued to weigh on business, although trends had improved significantly compared with the second quarter.
For Anthony Capuano, President & CEO of Marriott International, the results reflect the group’s commercial momentum, the strength of its brands and the effectiveness of its distribution capabilities.
Reported net income reaches $794 million
Growth in hotel activity translated into improvements across the group’s principal financial indicators.

| Metric | Q3 2026 | Year-on-year change |
|---|---|---|
| Worldwide RevPAR | +6.5% | Constant currency |
| Reported operating income | $1.274 billion | +8.0% |
| Reported net income | $794 million | +9.1% |
| Adjusted EBITDA | $1.512 billion | +12.1% |
| Adjusted net income | $790 million | +17.2% |
| Diluted earnings per share | $3.04 | +13.9% |
Reported net income reached $794 million, compared with $728 million a year earlier.
Diluted earnings per share increased to $3.04, from $2.67 in the third quarter of 2025.
Adjusted EBITDA reached $1.512 billion, compared with $1.349 billion a year earlier.
These results demonstrate the group’s ability to translate growth in hotel activity into higher revenue and profitability.
Franchise and management fee revenues continue to increase
Franchise fees and base management fees reached $1.341 billion, an increase of 13% compared with the $1.190 billion recorded in the third quarter of 2025.
This growth was primarily attributable to three factors: higher revenues from co-branded credit cards, increased RevPAR and expansion of the number of rooms operating under the group’s brands.
Incentive management fees increased by 22% to $181 million, compared with $148 million a year earlier.
All regions recorded positive growth in these fees, with a particularly pronounced increase in the United States and Canada.
These results confirm the importance of Marriott’s franchise and management model in generating value.
By contrast, the net contribution from owned, leased and other activities declined to $41 million, compared with $70 million a year earlier, partly reflecting renovations and asset disposals.
More than 20,000 net rooms added in three months
Network expansion was another defining feature of the quarter.
Marriott added approximately 20,100 net rooms to its global portfolio between July and September 2026.
More than 13,400 net rooms were added in international markets.
At the end of the quarter, the group’s network comprised:
- More than 10,200 properties;
- Nearly 1.834 million rooms;
- Net room growth of 4.6% over twelve months.
Marriott also reported a record level of organic signings worldwide during the first nine months of 2026.
Conversions of existing properties now represent a significant component of this momentum.
They accounted for more than one-third of signings and over 40% of openings recorded since the beginning of the year.
This development highlights the importance of rebranding and asset repositioning within the group’s expansion strategy.
A record development pipeline of 4,209 hotels
At the end of September 2026, Marriott reported a worldwide development pipeline comprising 4,209 properties representing more than 634,000 rooms.
This represents a new record for the group.
Of these projects, 1,750 properties totalling more than 278,000 rooms were under construction, including hotels undergoing conversion.
The pipeline also included 266 properties representing more than 37,000 rooms whose development had been approved but for which contracts had not yet been signed.
More than half of the rooms in the pipeline are located in international markets.
This distribution confirms the growing importance of expansion outside North America in Marriott’s development strategy.
Marriott Bonvoy reaches approximately 309 million members
The Marriott Bonvoy loyalty programme also continued to expand.
At the end of the third quarter, it had approximately 309 million members worldwide.
The group emphasised the role of its brand portfolio, experiences and commercial partnerships, particularly with Uber and Starbucks, in developing this ecosystem.
For hotel owners and investors, the size of the loyalty programme represents an important commercial consideration when assessing a brand’s distribution capabilities.
However, Marriott did not disclose the proportion of bookings generated through Marriott Bonvoy during the quarter in the information released.
$4 billion returned to shareholders
Marriott continued its capital return policy.
During the third quarter, the group repurchased 3.5 million shares for $1.3 billion.
From the beginning of the year through 28 October 2026, Marriott returned approximately $4 billion to shareholders through dividends and share repurchases.
Total debt stood at $16.8 billion at the end of September, compared with $16.2 billion at the end of December 2025.
Cash and cash equivalents amounted to $500 million.
The group also refinanced its credit facility, extending its maturity to September 2031 and increasing its size from $4.5 billion to $5 billion.
2026 outlook: Marriott raises its expectations
Following its third-quarter performance, Marriott has revised upwards its worldwide RevPAR growth forecast for the full 2026 financial year.
The group now expects growth of between 4.5% and 5%, on a constant-currency basis.
This revision reflects the quarter’s results and the assumption that hotel demand will remain robust.
Marriott nevertheless emphasised that these forecasts remain dependent on developments in the macroeconomic and geopolitical environment.
LTH Analysis | Marriott strengthens its fee-driven growth model through conversions
Marriott International’s third-quarter 2026 results highlight three drivers of value creation.
The first is growth in franchise and management fee revenues, which are increasing faster than worldwide RevPAR. Network expansion, co-branded credit card revenues and incentive management fees are contributing to this momentum.
The second driver is the expansion of the room portfolio. With more than 20,000 additional net rooms during the quarter, Marriott continues to pursue growth largely supported by real estate investment undertaken by its owner partners.
The third driver is the growing importance of conversions. Their share of signings and openings illustrates international hotel groups’ interest in existing assets that can join their networks without necessarily requiring new property developments.
For investors, this trend may create opportunities to reposition existing hotels, but it also requires an assessment of renovation costs, contractual obligations and the potential performance benefits associated with a change of brand.
The record pipeline of more than 634,000 rooms is an important indicator of the attractiveness of Marriott’s brands to developers and owners.
However, it should not be interpreted as a volume of guaranteed openings: some projects remain subject to financing conditions, regulatory approvals and construction schedules.
Meanwhile, the group continues to return substantial amounts of capital to shareholders alongside an increase in its debt.
For hotel owners, the central question remains the net value created by a brand, after accounting for fees, required investment and distribution costs.
Marriott’s results confirm the economic strength of its business model, but performance must also be assessed at the level of each individual hotel asset.
At a Glance
RevPAR: Worldwide RevPAR increased 6.5% in Q3 2026, including 7.4% growth in the US and Canada.
Profitability: Adjusted EBITDA reached $1.512 billion, up 12% year-on-year.
Net income: Reported net income rose 9% to $794 million.
Network growth: Approximately 20,100 net rooms added during the quarter, taking the global system to nearly 1.834 million rooms.
Development pipeline: Record 4,209 properties and more than 634,000 rooms.
Outlook: Marriott raised its full-year 2026 worldwide RevPAR growth forecast to 4.5–5%.